by Francisco Rodríguez, Head of Research at the Human Development Report Office In a post published last Thursday, Bill Easterly and Laura Freschi criticize the new formula for the Human Development Index (HDI) introduced in this year’s Human Development Report. Borrowing on a recent paper by the World Bank’s Martin Ravallion, Easterly and Freschi argue that our decision to shift from an additive to a multiplicative mean makes Africa look much worse than it should.
The relevant question, of course, is not whether the index makes any particular region or country look better or worse but whether the methodological changes introduced in the new version of the HDI make sense. If we reject the methodology, we should do it based on the soundness of its principles, not on whether or not we like its conclusions.
Why the HDI has a new functional form – and what it means
One of the key changes to the HDI functional form introduced in this year’s report was to shift from an arithmetic to a geometric mean. The purpose of this change was to introduce imperfect substitutability into the index. Imperfect substitutability means that the less you have of something, the more you will benefit from improvements in that dimension. By contrast, perfect substitutability (which had characterized the index’s old formula) means that how much you care about one dimension has nothing to do with its initial value.
The old perfect substitutability assumption had been extensively criticized, with good reason.{{1}} Imagine a country that has just suffered a health crisis – like an HIV epidemic. Logic would suggest that such a country should give greater emphasis to efforts to improve health after the crisis than it would have done had there been no crisis. But perfect substitutability precludes that.
Once you have imperfect substitutability, it will automatically be true that if you have very low levels of achievement in one dimension relative to another one, then you will care much more about the dimension in which you are doing worse relative to the one in which you are doing better. This is the source of the ‘troubling’ trade-offs that Easterly, Freschi and Ravallion point to.
So how should we interpret the 17,000 to 1 number that Easterly, Freschi and Ravallion fret about?{{2}} First, it is important to understand that the HDI is not a utility function, nor is it a social welfare function. It is an index of capabilities.{{3}} As such, it attempts to give us a picture of the average conditions that people in a particular country have to develop alternative meaningful life plans. Income is a useful input into these capabilities insofar as it allows people to have access to goods and services – such as nourishment, shelter and clothing – that are essential to live dignified lives. After these basic conditions have been attained, the contribution of income to enhancing capabilities drops off significantly.{{4}}
The correct way to interpret the gaps that Easterly, Freschi and Ravallion point to are thus as differences in the relative contribution of income vis-à-vis health in furthering capabilities. Since the relative contribution of income to furthering capabilities is infinitesimally small in rich countries, it looks huge by comparison in poor countries. Societies may and do value other things than their capabilities, so the HDI tells you nothing about the intrinsic value of the dimensions included in it – it simply tells you what their relative contribution is to expanding capabilities.
We may of course disagree as to whether imperfect substitutability and the asymmetric treatment of income are desirable properties, or even whether we should use an index of capabilities to measure development. HDRO would very much welcome a debate about these issues. Regrettably, neither Ravallion nor Easterly and Freschi have offered a justification of why they disagree with these principles on normative grounds, nor have they offered alternative normatively founded principles as a better alternative.{{5}} If the Easterly-Ravallion argument is that per capita income is a better measure of development, we must then agree to disagree.
Does the new HDI make Sub-Saharan Africa look worse?
What is the net effect of the new functional form on the relative position of Africa vis-à-vis the rest of the world? In the 2010 Human Development Report, Africa’s average HDI stands at .389, or 62.3 percent of the world HDI. If we had applied the old functional form, then Africa’s HDI would have been 64.1 percent of the world average. So does the new HDI make Africa look worse? Yes, exactly 1.8 percentage points worse. While one can of course try to make a big deal about that, as Easterly and Freschi do picking up on the former’s earlier complaints about the MDGs, it seems that nothing in the general picture of Africa’s relative progress vis-à-vis the rest of the world really changes from the new functional form.
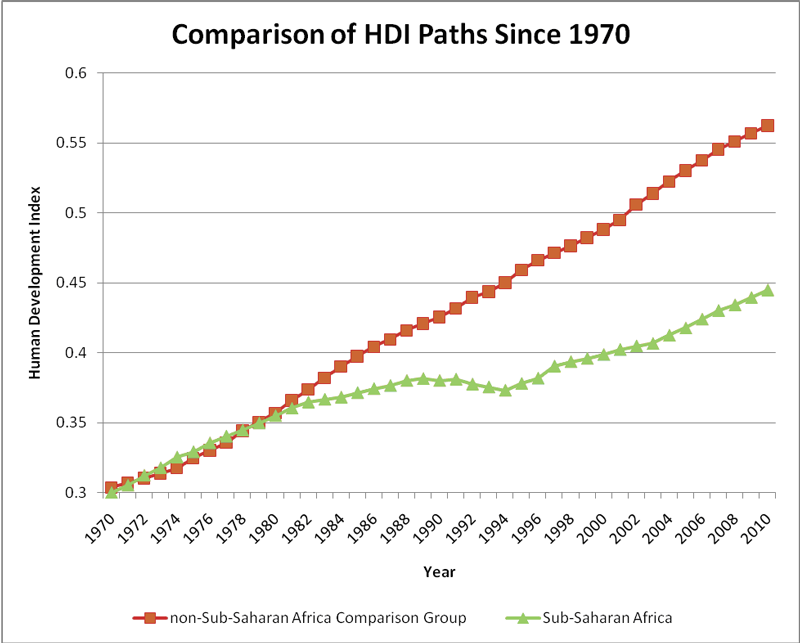
As Easterly and Freschi point out, the HDR also introduces a measure of progress that evaluates progress relative to other countries with similar starting points. Overall, Africa does not do well according to this measure in the period since 1970, if we consider the four decades as a whole. This is for the simple reason that African countries did much worse than other countries with similar starting points since 1970. Figure 1 below compares the average HDI of Sub-Saharan Africa with that of the 11 lowest 1970 HDI countries in other regions (a comparison group which has on average the same 1970 HDI as SSA). It is clear that SSA countries were significantly outperformed by countries outside of the region, particularly during the disastrous 1980s. There are numerous country examples that illustrate this general result: Nepal, Oman and Tunisia had respectively similar HDIs in 1970 to Zimbabwe, DR Congo and Zambia. Whereas the former group saw an average increase of 76 percent in their HDIs during this period, the three sub-Saharan African countries all saw absolute declines.
Of course, Africa is hugely diverse and these regional averages hide a lot. While Africa is home to the three only countries in our analysis that experienced deteriorations in their HDI in the past 40 years, some countries in the region have done quite well. Over the whole 1970-2010 period, Ethiopia ranks 11th in terms of overall HDI improvement, while Benin ranks 18th.
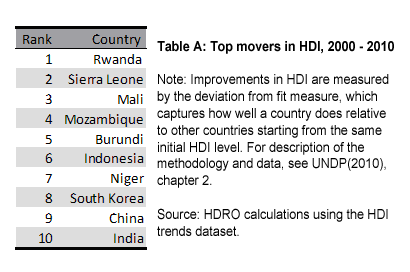
If Easterly and Freschi’s point were correct and the problem is the methodological fault of the HDI and the measure of progress presented in the 2010 HDR, we should not see some African countries performing as well as Ethiopia or Benin, nor would we see Africa do well either in the more recent period. However this is not the case. Indeed using the same measure of progress, Africa does much better overall since 2000, because its relative performance in all the component indicators has been much stronger. As shown in Table 1 below, which applies the same methodology for measuring progress to the last ten years, Africa has six of the top 10 performers in the world, including all the top five (Rwanda, Sierra Leone, Mali, Mozambique and Burundi). Odd results indeed for an index which by design is claimed to be biased against Africa.
References
Anand, S. and Sen, A.K. (1993), Human Development Index: Methodology and Measurement. HDRO Occasional Paper. New York: UNDP.
Chakravarty, Satya R., 2003, “A Generalized Human Development Index,” Review of Development Economics 7(1): 99-114.
Desai, Meghnad (1991), ‘Human Development: concepts and measurement’, European Economic Review 35, p. 350–357.
Lind, Niels (2004), 'Values Reflected in the Human Development Index', Social Indicators Research 66, p. 283-293.
Ravallion, Martin (1997), “Good and bad growth: The human development reports”, World Development 25:5, p. 631-638.
Ravallion, Martin, 2010, “Troubling Tradeoffs in the Human development Index,” Policy Research Working Paper 5432, World Bank, Washington DC.
Sagar, Ambuj and Adil Najam (1998), ‘The Human Development Index: A Critical Review’, Ecological Economics 25, no. 3, June, p. 249-264.
Sen, Amartya (1980), “Equality of what?”, in S.M. McMurrin (Ed.), Tanner Lecture on Human Values, Vol. I, Cambridge: Cambridge University Press.
UNDP(2010) The Real Wealth of Nations: Pathways to Human Development. New York: Palgrave Macmillan.
[[1]]See, for example, Desai (1991), Sager and Najam (1998), Lind (2004).[[1]]
[[2]]Ravallion refers to the marginal rate of substitution of years of life for income as the value of longevity, an interpretation with which we disagree. This is different from the interpretation that Easterly and Freschi give of it as the “value of life”, which is mathematically incorrect because an additional year of life is not the same thing as an additional life.[[2]]
[[3]]For the notion of capabilities and its relationship to the human development approach, see Sen (1980). For the treatment of income in the HDI, see Anand and Sen, 1993.[[3]]
[[4]]This is the reason why the HDI (in the old as well as the new formula) treats income asymmetrically through a log transformation. See Anand and Sen (1993) for a discussion.[[4]]
[[5]]Ravallion (2010) does propose an index, based on Chakravarty (2003), which maintains imperfect substitutability but not the asymmetric treatment of income. However, he offers no normative justification for removing the asymmetric treatment of income. A full discussion of Ravallion’s proposal will be provided in a forthcoming HDRO response.[[5]]
 From Aid to Equality


